Installation
This project is intended to be run using either Matlab or Octave. More information regarding the installation process can be found here.
Workflow
The recommended workflow for using the TASBE package is to process your data in three stages:
- Creation of a ColorModel which translates raw FCS data to comparable unit data.
- Using the created ColorModel for batch processing of experimental data.
- Comparison and plotting of the results from analysis.
Example files are provided that show how these stages typically work.
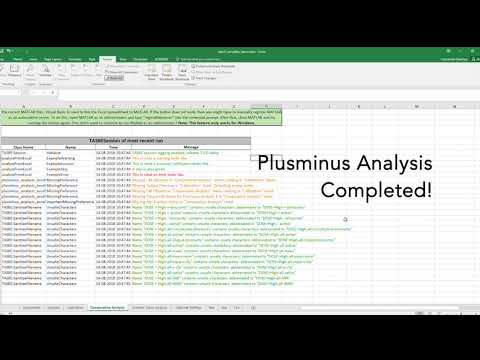
Excel Interface
The workflow described above has been consolidated into a new Excel interface feature that provides a user-friendly bridge between raw FCS data and current TASBE data analysis tools. Users can document important aspects of their experiments without having to worry about writing Matlab code. More information can be found here.
Demo Video
Tutorials
We have provided a collection of tutorials and examples in order to help users more easily use the TASBE package:
- Getting Started
- Introduction to Flow Cytometry (not web formatted)
- Creating a ColorModel
- Running Analysis
- Example Files
- Repository of tutorials, templates and example files
Additional Resources
Citation
If you make use of the TASBE Flow Analytics package, please cite the following publication:
- Jacob Beal, Cassandra Overney, Aaron Adler, Fusun Yaman, Lisa Tiberio, and Meher Samineni. “TASBE Flow Analytics: A Package for Calibrated Flow Cytometry Analysis,” ACS Synthetic Biology, 8(7), pp 1524–1529, May 2019
Users are encouraged to report any bugs using the Github Issue Tracker which can be found here.